NetHogs is a lightweight, open-source network bandwidth monitoring tool (similar to Top for process monitoring) that can help you identify the process or application consuming the most network traffic bandwidth in real-time.
All detected processes will be listed with their PID, owner, program (PATH, IP address, or hostname), sent and received data, and, unlike other network monitoring tools, it does not rely on any special kernel module.
It can be used in various scenarios, such as if there is a sudden spike in network traffic that seems unusual; you can initiate NetHogs to find the source of this issue and take further action.
In today’s article, you’ll learn how to install NetHogs on the most popular Linux distribution and its command-line usage with a practical example.
Tutorial Details
| Description | NetHogs: Network Bandwidth Monitoring Tool |
| Difficulty Level | Low |
| Root or Sudo Privileges | Yes |
| OS Compatibility | Ubuntu, Manjaro, Fedora, etc. |
| Prerequisites | – |
| Internet Required | Yes (for installation) |
How to Install NetHogs on Linux
The NetHogs can be easily installed in most Linux distributions with the default package manager by running one of the appropriate commands.
#On Debian and Ubuntu
$ sudo apt install nethogs

#On RedHat and CentOS
$ sudo yum install epel-release
$ sudo yum install nethogs

#On Fedora
$ sudo dnf install nethogs

#On Arch and Manjaro
$ sudo pacman -S nethogs

#On OpenSUSE
$ sudo zypper i nethogs

#On Alpine Linux
$ sudo apk add nethogs
Usage of NetHogs
After the installation is complete, you can access the “nethogs” command with or without specifying the interface (autodetected if left empty), but ensure to run the command with root or sudo privileges.
$ sudo nethogs
#OR
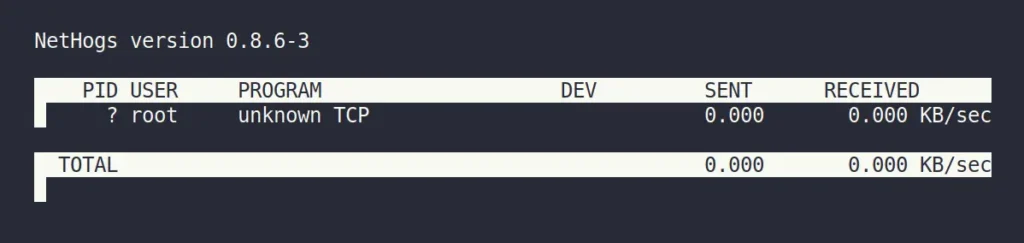
$ sudo nethogs [interface1] [interface2]If there is no network activity in the background when you launch it, you will receive the following stale output:
For demonstration purposes, I’ve initiated a system update in the background, and once there is certain network activity, NetHogs will start reporting it in real-time.
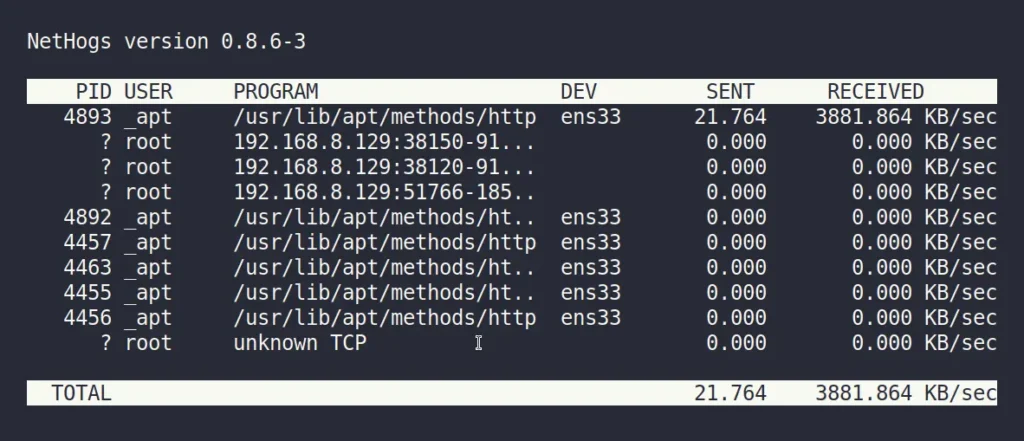
As you can see, each process is listed in rows along with its respective PID, owner, program, device, sent, and received data that you can use for your investigation.
The following are a few keyboard shortcuts that you can use in NetHogs.
| Key | Usage |
|---|---|
m | Cycle between (KB/s, MB/s, GB/s) modes in the sent and received columns. |
s | Sort by sent traffic. |
r | Sort by received traffic. |
q | Quit and return to the shell prompt. |
The following are options that you can use with NetHogs:
| Option | Description |
|---|---|
-d | Set time interval for refresh (default is 1 for 1 second). |
-v | Set mode for send and receive columns (0 = KB/s (default), 1 = total KB, 2 = total B, 3 = total MB, 4 = MB/s, 5 = GB/s). |
-c | Set the number of updates (default is 0 for ulimited). |
-t | Tracemode. |
-s | Sort output by sent column. |
-r | Sort output by received column. |
-a | Monitor all devices, including loopbacks and stopped ones. |
-C | Capture UDP and TCP traffic. |
-h | Print the help. |
As you can see, it’s a very basic command-line tool, but it can be very helpful sometimes. If you have any questions or queries related to the topic, then do let me know in the comment section.
Till then, peace!