Nload is a simple networking tool that monitors your network traffic and bandwidth usage in real-time, visualizing the incoming and outgoing data results in two separate ASCII graphs.
In addition to the graph, it also provides additional information, such as the total amount of transferred data and the minimum/maximum network usage for your investigation.
If there is a sudden spike in network bandwidth, then you can use a tool like NetHogs to identify the process or application responsible for it and take appropriate action afterwards.
In this article, we solely focus on the installation of Nload on the most popular Linux distribution and command-line usage with practical examples.
Tutorial Details
| Description | Nload: Monitor Network Traffic and Bandwidth Usage in Graph |
| Difficulty Level | Low |
| Root or Sudo Privileges | No |
| OS Compatibility | Ubuntu, Manjaro, Fedora, etc. |
| Prerequisites | – |
| Internet Required | Yes (for installation) |
How to Install Nload on Linux
Nload can easily be installed on any Linux distribution using its default package package by running one of the appropriate commands.
#On Debian and Ubuntu
$ sudo apt install nload

#On RedHat and CentOS
$ sudo yum install epel-release
$ sudo yum install nload

#On Fedora
$ sudo dnf install nload

#On Arch and Manjaro
$ sudo pacman -S nload

#On OpenSUSE
$ sudo zypper i nload

#On Alpine Linux
$ sudo apk add nload

#On OpenBSD System
$ sudo pkg_add -i nload

#On macOS
$ brew install nload
Usage of Nload
Once the installation is complete, you can access the “nload” command with or without specifying the interface (it will detect all interfaces if none are specified).
$ nload

#OR

$ nload [interface]
Output:
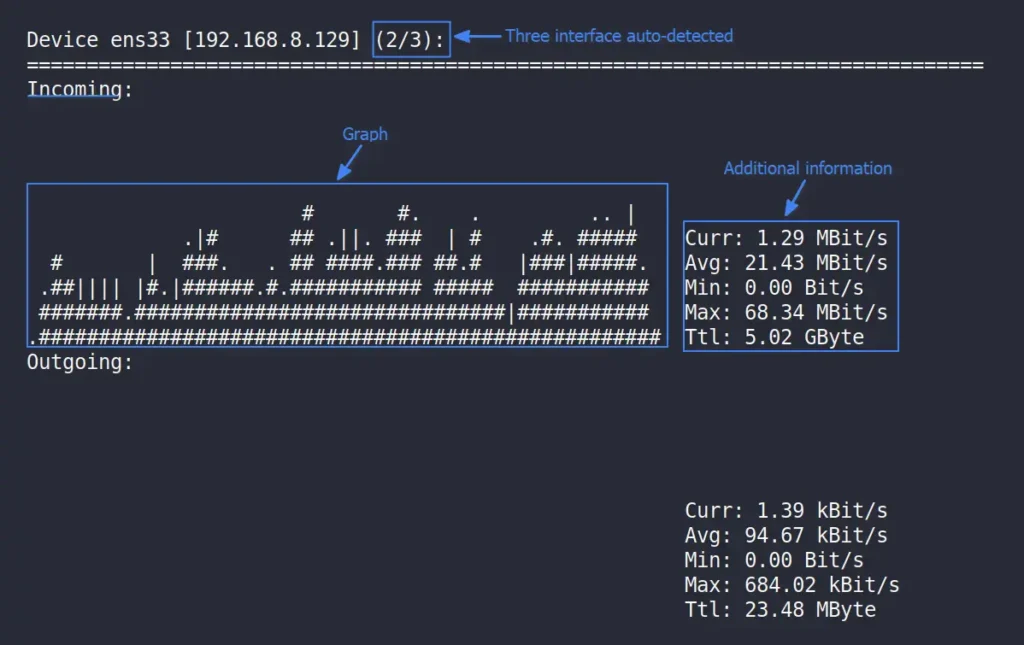
In the above picture, you can see that three interfaces have been detected (because none are specified), which you can switch between by pressing the left and right arrow keys.
The incoming and outgoing data are also beautifully shown in two distinct graphs, with additional information next to each graph that you can use to monitor your network activity usage.
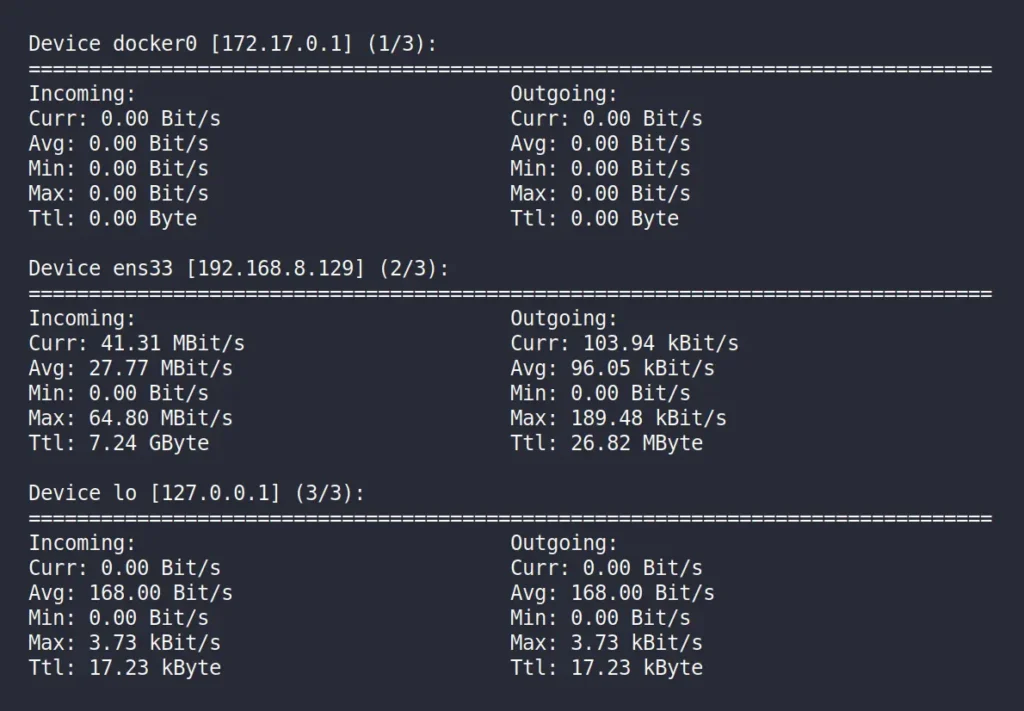
To monitor all the network interfaces at once, you can use the “-m” option with the “nload” command.
$ nload -mOutput:
The following are a few keyboard shortcuts that you can use in Nload.
| Key | Usage |
|---|---|
| left and right arrow key | Cycle through each auto-detected network device. |
| F2 | Show the option window. |
| F5 | Save current settings to the user’s config file. |
| F6 | Reload settings from the config files. |
| q or Ctrl+c | Quit and return to the shell prompt. |
The following are options that you can use with NetHogs:
| Option | Description |
|---|---|
-a | Sets the length in seconds of the time window for average calculation (default is “300“). |
-t | Sets the refresh interval of the display in milliseconds (default value is “500“). |
| -u h|b|k|m|g|H|B|K|M|G | Sets the type of unit used for the display of traffic numbers (default is “h“). h: auto, b: Bit/s, k: kBit/s, m: MBit/s etc. H: auto, B: Byte/s, K: kByte/s, M: MByte/s etc. |
| -U h|b|k|m|g|H|B|K|M|G | Same as -u, but for a total amount of data (without “/s”) and by default it uses “H“. |
That’s it for today’s article. If you have any questions or queries related to the topic, then do let me know in the comment section.
Till then, peace!