
As a system administrator, you may want to look for various information on your workstation or server system, such as how long the system has been running.
This way, you can keep track of the system resources and optimize based on your usage. Unfortunately, the uptime command used to get this information only returns information for the current session.
Surprisingly, you have an external tuptime command-line tool that can offer you historical and statistical uptime information for your Linux system.
Tutorial Details
| Description | Find Historical and Statistical Uptime Information for Linux |
| Difficulty Level | Low |
| Root or Sudo Privileges | No |
| OS Compatibility | Ubuntu, Manjaro, Fedora, etc. |
| Prerequisites | tuptime |
| Internet Required | Yes |
What is the Linux Tuptime Tool?
The tuptime is an external command-line utility in Linux used to check the report of historical and statistical running time of a Linux system.
The functionality is identical to uptime, except it offers you historical and statistical uptime data with more advanced output.
Tuptime Features
The following is a list of the features offered by this tool:
- Count system startups.
- Print the current uptime.
- Register the first boot time.
- Register used kernels and boot IDs.
- Count both intentional and unintentional shutdowns.
- Calculate the uptime and downtime percentages since the first boot.
- Calculate the average, shortest, and largest uptime and downtime.
- Calculate the accumulated system uptime (running and sleeping), downtime, and total.
- Print a formatted table or list with the system history.
- Output in CSV format.
How to Install Tuptime Tool in Linux
As previously stated, this is an external command-line tool that must be installed separately on your Linux system using the methods mentioned in this section.
The easiest way to install this command-line tool is to use the system’s default package manager to run any one of the following commands:
$ sudo apt install tuptime                                                                           #On Debian and Ubuntu
$ sudo dnf install tuptime                                                                           #On Red Hat and Fedora
If you are using a different system that does not include this tool in its repository, then you have to follow the next method, where you have to run a shell script that will automatically clone and copy the binary into your bin directory and configure the cron job for you.
$ bash < <(curl -Ls https://git.io/tuptime-install.sh)If you prefer manual installation, then you can follow this guide.
How to Use the Tuptime Tool in Linux
The tuptime command takes one argument as an option (optional).
$ tuptime [OPTION]Most of the time, you will run this command without specifying any options, and as you do, you will be presented with the following screen.
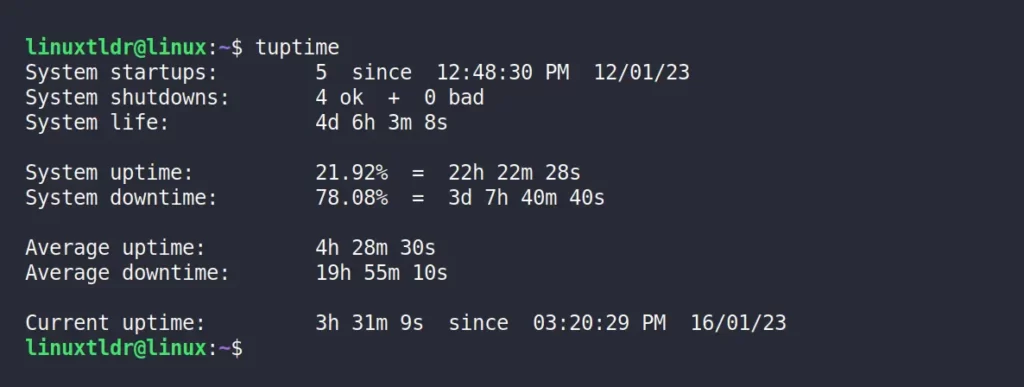
From the above picture, you can clearly see the historical and statistical uptime information for my Linux system.
It includes the number of system startups since the tuptime was installed, the number of good/bad shutdowns, the current system uptime, the average uptime/downtime, etc.
Change the Date and Time Format
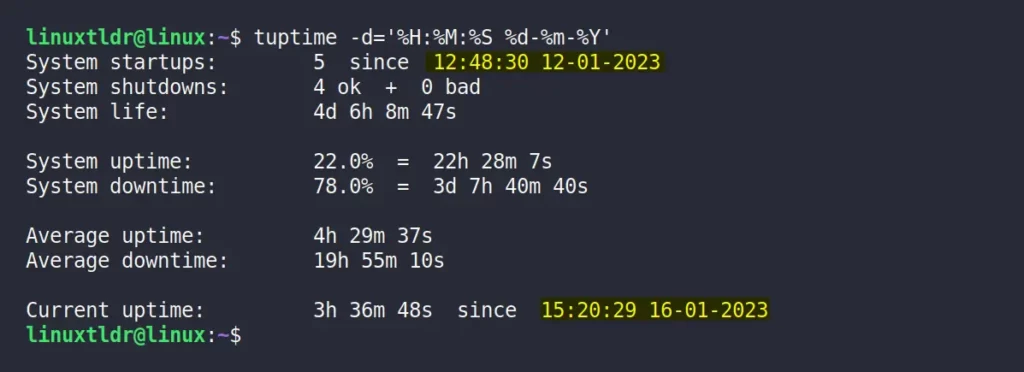
Using the “-d” flag, you can specify your own custom date and time format, as one shown in the following example.
$ tuptime -d='%H:%M:%S %d-%m-%Y'Output:
Display the System Kernel Version and Boot ID
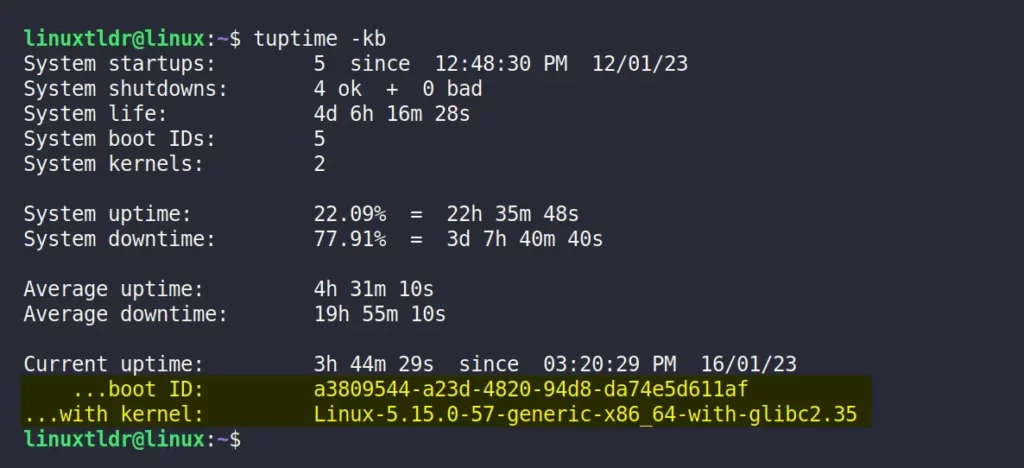
The “-k” flag will display the kernel version, and the “-b” flag will display the boot ID of the system.
$ tuptime -kbOutput:
Display the System Life in List
The “-l” flag will display the system life (or each session uptime information) in a list.
$ tuptime -lOutput:

Display the System Life in Table
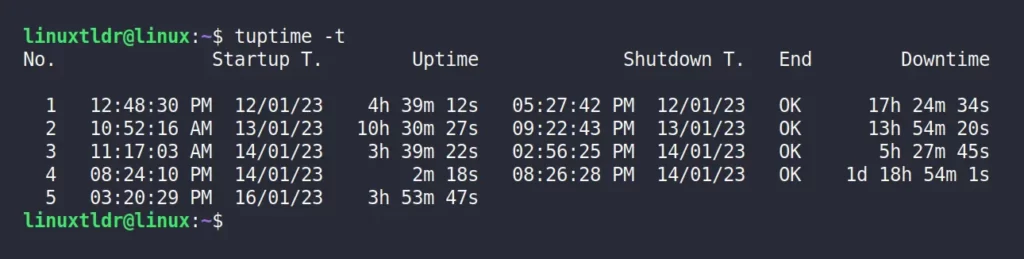
The “-t” flag can be used in the same way as the previous command to show the system life in a table.
$ tuptime -tOutput:
Display Detailed System Life Information
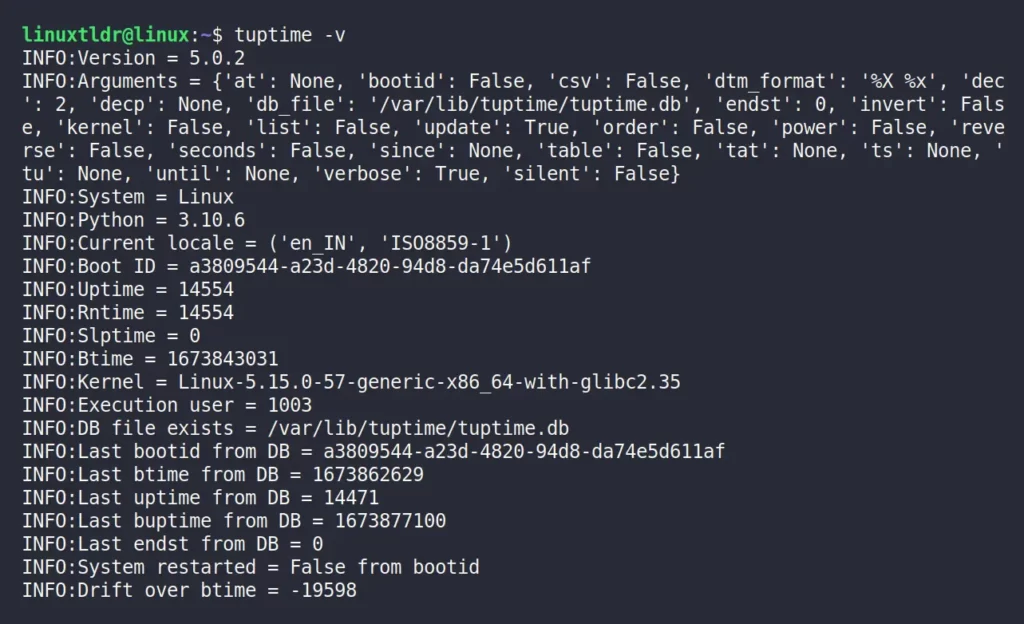
The “-v” flag will enable the verbose mode, which basically gives you the complete information for various parameters that require a separate flag.
$ tuptime -vOutput:
Save the Output in a CSV File
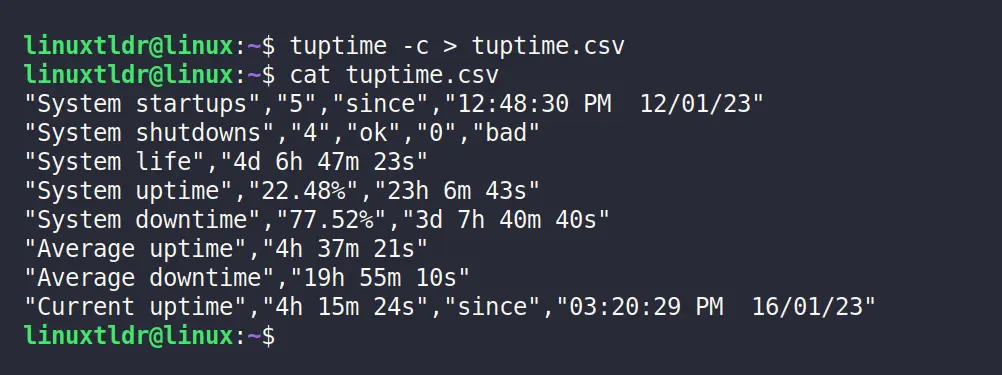
The “-c” flag will print the output in CSV format, which can be saved in a “.csv” file using the “>” redirection symbol.
$ tuptime -c > tuptime.csv
$ cat tuptime.csv
Output:
Specify a Custom Database Path
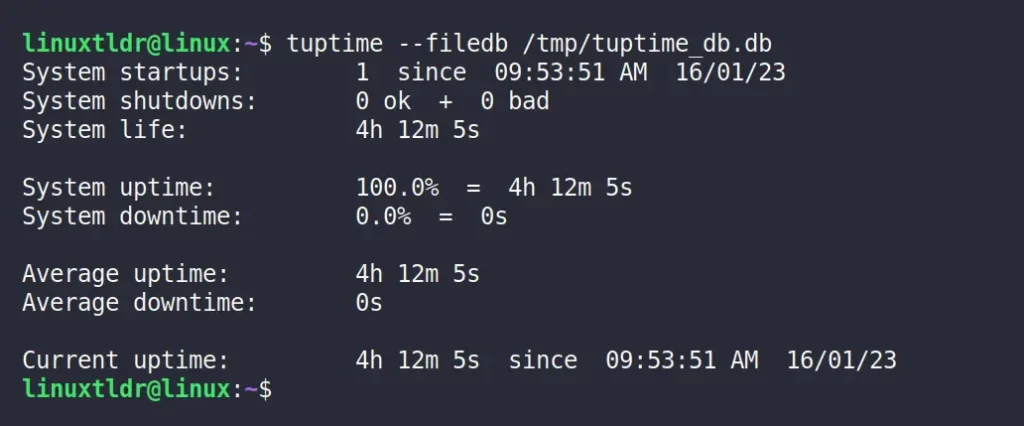
To change the default database to a different one, use the “--filedb” option with the path to the new database as an argument.
$ tuptime --filedb /tmp/tuptime_db.dbOutput:
Conclusion
I hope you will find this article useful and that you have learned another amazing sysadmin tool in your Linux journey.
However, if you have any questions or queries related to this topic, feel free to ask them in the comment section.
Till then, peace!


The report with “-v” shows that you have a large drift. Check your time sync and also the BIOS battery.
It doesn’t matter because it’s VM. 😄
Does it allow report the last year uptime?